
Total Cost of Ownership: How to calculate the TCO in battery
Total Cost of Ownership (TCO) in batteries is the full cost of having and using a battery over its entire life cycle. When you install thousands of smart meters across your service territory, the upfront battery price seems like the biggest expense. But what if that cheap battery fails in year five? You’ll face truck rolls, labor costs, and customer complaints. The real financial pain comes from hidden costs you didn’t factor into your initial decision.
Total cost of ownership (TCO) for batteries includes purchase price, installation labor, maintenance visits, replacement frequency, disposal fees, and downtime costs over the entire operational lifespan. For smart meters using primary lithium batteries, TCO calculations must account for 10-20 year deployment cycles, temperature performance, self-discharge rates, and field failure rates[1] to determine true economic value.

This article breaks down each TCO component with calculation methods and real-world examples. You’ll learn how to compare battery options beyond sticker price.
Table of Contents
- What Is TCO in Battery?
- How Do Primary Lithium Batteries Compare to Alternatives in Long-Term TCO?
- What Calculation Framework Should You Use for Battery TCO Analysis?
- How Does Temperature Performance Impact Your Total Cost of Ownership?
What is TCO in battery?
Battery TCO comprises seven major cost categories: initial purchase price, shipping and handling, installation labor, scheduled maintenance, unscheduled service calls, replacement cycles, and end-of-life disposal. Smart meter deployments must also factor in data loss costs, regulatory compliance expenses[2], and customer satisfaction impacts[3] when batteries fail prematurely.

The purchase price is just the starting point. When you deploy 50,000 smart meters, even a $2 difference in battery cost equals $100,000. But that’s a one-time expense. The recurring costs tell a different story.
Installation labor[4] varies by location. Urban installations might cost $50 per meter with easy access. Rural or difficult-access locations can run $200 or more per visit. If you need to replace batteries twice during a 20-year meter life instead of once, you’ve doubled your labor costs for that component.
Maintenance costs appear in two forms.
Scheduled maintenance follows your planned routes and timing. Your crews can optimize their schedules and combine multiple tasks.
Unscheduled service calls happen when batteries fail unexpectedly. These emergency visits cost 3-5 times more than planned maintenance because you can’t batch them efficiently.
Data loss[5] creates hidden costs. When a meter loses power, you lose consumption data. This forces you to estimate usage, which leads to billing disputes and customer service calls.
Some utilities report data gap costs of $15-30 per incident when you factor in call center time and potential revenue loss.
Disposal fees keep rising as environmental regulations tighten.
Lithium batteries require special handling and recycling processes. Current disposal costs range from $0.50 to $2.00 per battery depending on your location and volume.
But these fees have increased 40% over the past five years in many jurisdictions.
Cost Category Breakdown for 10,000 Meter Deployment
| Cost Category | Per Unit Cost | Frequency (20 Years) | Total Cost |
|---|---|---|---|
| Battery Purchase | $12.00 | 1x | $120,000 |
| Installation Labor | $75.00 | 1x | $750,000 |
| Replacement Labor | $85.00 | 1x (Year 12) | $850,000 |
| Emergency Service | $250.00 | 2% Failure Rate | $50,000 |
| Disposal Fees | $1.50 | 2x | $30,000 |
| Total TCO | – | – | $1,800,000 |
The table shows why battery purchase price represents only 6.7% of total cost of ownership. Installation and replacement labor dominate the expense structure.
This math explains why utility managers increasingly focus on battery longevity rather than just initial cost.
Warranty coverage affects TCO calculations significantly.
Some manufacturers offer 10-year warranties, others provide only 2-3 years. A comprehensive warranty reduces your risk exposure. But you need to read the fine print.
Does the warranty cover labor costs? Who pays for shipping? What conditions void the coverage?
Temperature effects create another cost layer. Batteries that work well in laboratory conditions might fail rapidly in extreme field environments.
A battery rated for 20 years at 25°C might last only 8 years at 60°C. This performance degradation doesn’t always appear in initial specifications.
Self-discharge rates matter more than most people realize. A battery losing 3% capacity per year starts with 100% but drops to 70% after 10 years from self-discharge alone.
When you add actual load consumption, you might hit the end-of-life threshold much sooner than expected. This accelerated timeline triggers earlier replacement cycles and increases your total cost of ownership.
How Do Primary Lithium Batteries Compare to Alternatives in Long-Term TCO?
Primary lithium batteries deliver 15-20 year operational life in smart meters with minimal maintenance, while alkaline batteries require replacement every 2-3 years and rechargeable options need complex charging infrastructure. LiSOCl2 chemistry provides the lowest total cost of ownership for utility metering because its extended lifespan eliminates multiple replacement cycles and associated labor costs.

Let me walk you through a direct comparison. Standard alkaline batteries cost $3-5 per unit for meter applications. That looks attractive compared to $12-15 for primary lithium. But alkaline batteries last only 2-3 years in typical smart meter duty cycles. Over 20 years, you’ll replace them 6-8 times.
Each replacement means a truck roll.
Your technician drives to the site, accesses the meter, swaps the battery, tests the system, and closes everything up. At $85 per visit, those 7 replacement cycles cost $595 in labor alone.
Add 7 batteries at $4 each ($28) and you reach $623 per meter. Compare that to one lithium battery at $12 plus one replacement at year 12 ($12 battery + $85 labor = $97), totaling $194 over 20 years.
Rechargeable lithium-ion systems present different trade-offs.
The battery pack costs $25-40 upfront. You need charging circuitry, which adds $15-20 to the meter design. Solar panels for remote locations run another $30-50. Your total upfront investment reaches $70-110 per meter location.
But rechargeable systems face reliability questions in harsh environments. Cold weather reduces charging efficiency.
Dust and debris can block solar panels. Charging circuits add failure points. When these systems fail, you’ve lost your entire investment and still need to install a primary battery backup.
Hybrid supercapacitors occupy an interesting middle ground. These devices combine a primary lithium cell with a supercapacitor for pulse power delivery.
The supercapacitor handles high-current events like radio transmissions. The primary cell provides baseline power and recharges the supercapacitor slowly. This arrangement extends battery life beyond standard primary cells.
Long Sing Technology produces hybrid supercapacitor solutions specifically for smart metering. These systems deliver 20+ year operational life while handling pulse currents up to 15A.
The hybrid approach costs more initially but eliminates replacement cycles entirely for many applications.
20-Year TCO Comparison for 10,000 Smart Meters
| Battery Type | Unit Cost | Replacements | Labor Cost | Total per Meter | Fleet Total |
|---|---|---|---|---|---|
| Alkaline | $4.00 | 7x | $595 | $623 | $6,230,000 |
| Lithium Thionyl | $12.00 | 1x | $160 | $184 | $1,840,000 |
| Hybrid Supercap | $22.00 | 0x | $75 | $97 | $970,000 |
| Rechargeable Li-ion | $85.00 | 0.5x (5% failure) | $117 | $202 | $2,020,000 |
The numbers reveal why primary lithium and hybrid systems dominate modern smart meter deployments.
Alkaline batteries cost 3.4 times more over 20 years despite their lower purchase price. Even accounting for a 5% failure rate on rechargeable systems, the added complexity and higher initial cost make them less attractive for most utility applications.
Environmental conditions shift these calculations.
In extreme cold below -40°C, rechargeable systems often fail completely. Primary lithium batteries continue operating.
In high-heat environments above 70°C, all battery chemistries degrade faster, but lithium thionyl chloride maintains relatively better performance.
Pulse current requirements matter significantly.
Smart meters with cellular modems can draw 2-3A pulses during transmission. Standard primary lithium cells struggle with these high currents. Hybrid supercapacitors handle pulses easily.
If your application has high pulse demands, the hybrid option delivers better reliability despite higher cost.
Volume discounts change the equation for large deployments. When you buy 100,000+ batteries, unit prices drop 20-30%.
But this benefit applies to all battery types. The relative cost advantage of long-life primary lithium batteries remains consistent across different volume levels.
Battery pack assembly adds another cost layer.
Some applications require multiple cells in series or parallel configurations.
Assembly labor, quality testing, and packaging increase the delivered cost by $8-15 per pack. Custom configurations cost more than standard single-cell products.
This is where working with an experienced battery pack manufacturer like Long Sing Technology provides value through optimized designs that minimize assembly costs while meeting performance requirements.
What Calculation Framework Should You Use for Battery TCO Analysis?
A complete TCO calculation framework multiplies unit costs by failure rates, replacement cycles, and service visit expenses, then applies a discount rate to account for the time value of money over the deployment period. You must include sensitivity analysis[6] for key variables like labor costs, battery lifespan, and failure rates to understand how assumptions affect your total cost of ownership results.

Start with the basic formula:
TCO = (Initial Cost + Installation) + Σ(Replacement Costs × Cycles) + Σ(Maintenance × Visits) + (Failure Rate × Emergency Service Cost) + Disposal Fees.
But this simple formula misses the time value of money. A dollar spent in year 15 costs less in today’s terms than a dollar spent now.
Apply a discount rate to future costs.
Use your company’s weighted average cost of capital (WACC) or a standard 5-7% discount rate. The formula becomes this in present value terms:
Present Value = Future Cost / (1 + discount rate)^years. A $100 replacement cost in year 12 at 6% discount equals $100 / (1.06)^12 = $49.70
This discounting significantly affects TCO comparisons.
Alkaline batteries with frequent early replacements show higher present value costs than lithium batteries with distant replacement dates. The math favors longer-life solutions even more strongly when you properly account for time value.
Build a spreadsheet model with separate rows for each year of operation. Column categories should include battery costs, labor costs, failure events, and maintenance activities. This year-by-year breakdown lets you see cash flow patterns and identify peak expense periods.
I recommend including at least five scenarios: best case, expected case, worst case, high-temperature, and high-failure variants.
Best case assumes optimal conditions and minimum replacement cycles. Worst case doubles the failure rate and shortens battery life by 30%. These scenarios show your exposure range.
Sensitivity analysis reveals which variables matter most. Change one input at a time by ±20% and measure the TCO impact.
If a 20% increase in labor costs raises TCO by $500,000 but a 20% increase in battery price adds only $50,000, you know labor optimization matters more than battery price negotiation.
TCO Calculation Variables and Typical Ranges
| Variable | Low Estimate | Expected | High Estimate | TCO Impact |
|---|---|---|---|---|
| Battery Lifespan | 15 years | 18 years | 22 years | High |
| Failure Rate | 0.5% | 2.0% | 5.0% | Medium |
| Service Call Cost | $75 | $125 | $250 | High |
| Battery Unit Cost | $10 | $14 | $20 | Low |
| Discount Rate | 3% | 6% | 9% | Medium |
The table shows that battery lifespan and service call costs drive TCO more than battery purchase price. This insight should shift your procurement strategy.
Spending 10% more on batteries to gain 20% longer life makes excellent financial sense.
Negotiating labor rates or improving route efficiency delivers bigger savings than squeezing battery suppliers on price.
Geographic factors require adjustment in your model.
Urban deployments with dense meter populations allow efficient route planning. Your crews can service 15-20 meters per day.
Rural deployments might achieve only 5-8 meters per day with long drive times between locations. This 3x productivity difference means rural installations cost 3x more per meter for the same battery replacement work.
Data collection improves your TCO accuracy over time.
Track actual failure rates by battery type, manufacturer, and installation year.
Record real service call costs including drive time, labor hours, and parts used. Update your model annually with actual data. After 3-5 years, your TCO predictions will be based on your specific operations rather than industry averages.
Some costs hide in unexpected places.
Customer complaints about meter failures create call center load. Each call might cost $8-12 to handle.
If battery failures generate 3 calls per incident on average (initial complaint, follow-up, resolution confirmation), add $30 per failure to your TCO model. These soft costs often equal 15-20% of hard costs but get overlooked in initial analyses.
Regulatory compliance creates another cost stream.
Some regions require utilities to maintain minimum service reliability standards. Battery failures that cause meter outages can trigger penalty payments or force accelerated replacement programs.
Build a contingency of 5-10% into your TCO model to account for compliance risks.
Monte Carlo simulation[7] provides sophisticated TCO analysis for large deployments.
This technique runs thousands of scenarios with randomized input variables based on probability distributions. The output shows not just expected TCO but also the probability distribution of outcomes.
You might find your expected TCO is $2.1M with 80% confidence it falls between $1.8M and $2.5M.
How Does Temperature Performance Impact Your Total Cost of Ownership?
Temperature extremes reduce battery capacity and accelerate self-discharge, cutting operational lifespan by 30-60% in harsh environments. Smart meters in outdoor installations face daily temperature swings from -40°C to +85°C, making temperature performance the single most important factor for total cost of ownership in utility applications beyond installation and labor costs.

Battery chemistry reacts to temperature in predictable ways.
For every 10°C increase above 25°C, chemical reaction rates roughly double. This accelerates both useful discharge and parasitic self-discharge.
A lithium thionyl chloride battery losing 1% capacity per year at 25°C might lose 2% per year at 35°C and 4% per year at 45°C.
Let’s calculate the real impact.
A battery rated for 20 years at room temperature drops to 10 years at constant 45°C operation and perhaps 5-7 years at 60°C. But smart meters don’t see constant temperatures.
They experience cycles. A meter in direct sunlight in Texas might see 70°C for 6 hours daily in summer, 25°C for 6 hours, and cooler temperatures at night.
Thermal cycling adds stress beyond simple high-temperature exposure.
Each heating and cooling cycle causes physical expansion and contraction of battery components. After thousands of cycles, internal connections can weaken.
Seals might develop micro-leaks. These mechanical stresses create failure modes that don’t appear in constant-temperature testing.
Cold temperature creates different problems.
Below -20°C, battery voltage drops and internal resistance increases. The battery might provide only 50% of its rated capacity at -40°C.
If your meter needs 3.6V minimum operating voltage and your battery provides only 3.2V in extreme cold, the meter shuts down even though the battery still holds 70% of its charge.
I’ve seen utilities in northern climates lose 15-20% of their meter fleet to cold-weather shutdowns during extreme cold snaps. The meters weren’t dead – they just couldn’t provide enough voltage at -35°C.
When temperatures rose, the meters came back online. But each shutdown event creates service calls, customer complaints, and missed billing data.
Battery Performance vs Temperature for LiSOCl2 Chemistry
| Temperature Range | Capacity Retention | Expected Lifespan | Self-Discharge Rate | Voltage Stability |
|---|---|---|---|---|
| -40°C to -20°C | 50-70% | 18-20 years | 0.5% / year | Reduced |
| -20°C to +25°C | 95-100% | 18-20 years | 1.0% / year | Excellent |
| +25°C to +55°C | 90-100% | 12-15 years | 2.0% / year | Good |
| +55°C to +85°C | 75-90% | 6-10 years | 4-6% / year | Fair |
| Above +85°C | 60-75% | 3-5 years | 8-12% / year | Poor |
These temperature effects directly multiply your total cost of ownership. Reducing battery life from 18 years to 10 years means you need a second replacement cycle.
That’s another battery purchase plus another full-fleet service call at $85 per meter. For 50,000 meters, that’s $600,000 plus battery costs triggered solely by temperature effects.
Conclusion
Total Cost of Ownership reveals the real economic value of a battery. By considering lifetime, reliability, maintenance, and replacement costs—not just purchase price—companies can select a power source that minimizes long-term expenses. In many industrial and IoT applications, ;long-life lithium chemistries such as LiSOCl₂ significantly reduce TCO by cutting field replacements, lowering labor cost, improving reliability, and keeping devices running for 10–20 years.
Contact BloggerNote:
[1]Understanding field failure rates helps in accurately calculating TCO and planning maintenance.↪
[2]Compliance costs can add significant expenses, making it essential to factor them into TCO.↪
[4]Installation labor can significantly impact the overall cost, especially in large deployments.↪
Read more about all information regarding to smart meter battery
- Revolutionizing Water Management: Smart Meter Batteries
- Smart Water Meter: Project with Primary Lithium Battery Solution
- Battery Guide: How to Choose a Long Life Smart Meter Battery?
- Types of Battery: A Guide to LiSoCl₂ Vs LiMnO₂
- Long Life Batteries: How to Validate Primary Lithium Battery Longevity
- Battery Temperature: How Does Extreme Temperatures Affect Long-Term Reliability
- Pulse Power: Why Does A Smart Meter Need Supercapacitor for Communication?
- Battery Replacement: Advanced lithium battery for the global smart meters industry
- Battery Size: What Kind of Battery Is In A Smart Meter
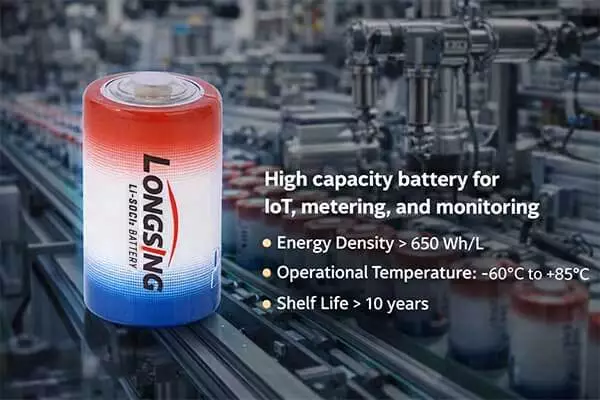
Choosing Li-SoCl₂ High Capacity Battery for IoT, Metering, and Monitoring Systems: What Buyers Need to Know
Li-SOCl₂ High Capacity Battery solutions are widely recognized as a reliable power choice for IoT,

Battery Temperature: How Does Extreme Temperatures Affect Long-Term Reliability
When devices fail early, battery temperature is often the hidden cause. Batteries lose performance w
10 Real-World Hybrid Supercapacitor Use Cases in 2026
Struggling with frequent battery replacements in remote industrial sites? Power failures cost time a