
The Real Cost of Cheap Batteries: How High Self Discharge Rate Increase Your TCO
Cheap batteries can look fine on day one, but hidden energy loss shows up later. That loss causes more service visits and earlier replacements. You lower lifetime cost when you treat Self Discharge Rate as a real cost driver, not a footnote.
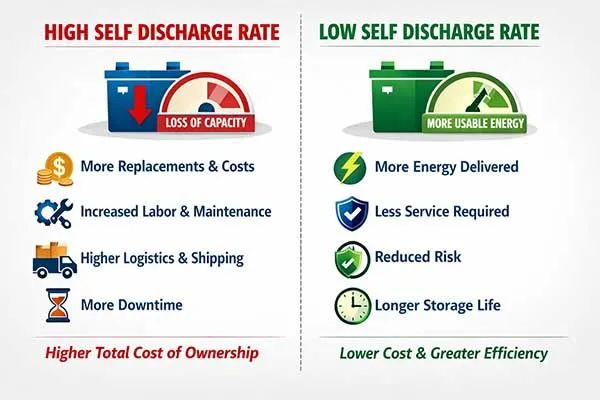
A high Self Discharge Rate increases total cost of ownership because the battery loses usable capacity during storage and low-load operation, which forces more replacements, labor, logistics, and downtime.
A lower Self Discharge Rate usually means more delivered energy per unit purchased, which reduces service frequency and risk.
If you want fewer surprises, you should connect Self Discharge Rate to your real timeline, temperature, and service cost.
Quick FAQ Review About Self Discharge Rage(Click to Unfold)
Q: What is a self-discharge rate?
A: The self-discharge rate is the rate at which a battery loses its stored charge over time when not in use or connected to a load, typically expressed as a percentage per month or year.
Q: What causes self-discharge?
A: Self-discharge is caused by internal chemical reactions within the battery, such as side reactions in the electrolyte, electrode degradation, and passivation layers. It is accelerated by higher temperatures (often doubling every 10°C rise), battery age, and full state of charge.
Q: What is a self-discharge battery?
A: All batteries experience self-discharge; there is no specific “self-discharge battery.” It refers to the natural phenomenon where any battery gradually loses charge due to internal reactions even when idle.
Q: How do you calculate self-discharge rate?
A: Measure the battery’s capacity or voltage initially after full charge, store it for a known period (e.g., one month), then measure again. The rate is:
[(initial capacity – final capacity) / initial capacity] × 100%
divided by the time period (e.g., per month). Alternatively, track voltage drop over time.
Q: What does a low self-discharge rate mean?
A: A low self-discharge rate means the battery retains most of its charge during long-term storage, allowing longer shelf life and readiness for use without frequent recharging.
Q: What is 80% DOD in battery?
A: 80% Depth of Discharge (DOD)[1] means the battery is discharged to 80% of its total capacity (leaving 20% remaining charge). It is a common recommended maximum for many batteries (e.g., lithium-ion or lead-acid) to balance usable energy with extended cycle life.
Q: How long does it take for a battery to self-discharge?
A: It varies by chemistry and conditions: A lithium primary battery typically self-discharges very slowly, losing about 0.5%–2% of its capacity per year at room temperature.
lithium-ion may lose 2-5% per month (fully discharging in years), lead-acid ~5% per month, while NiMH can lose 20-30% per month. Complete discharge can take months to years at room temperature.
Q: What is the self-discharge rate of a CR2032 battery?
A: A CR2032 (lithium coin cell) typically has a very low self-discharge rate of less than 1% per year at room temperature, enabling a shelf life of up to 10 years.
Q: How can I prevent battery discharge?
A: Store batteries in a cool, dry place (lower temperatures slow reactions); keep at partial charge (40-60% for lithium-ion); use low-self-discharge variants; avoid extreme heat; and periodically check/recharge if stored long-term.
Q: Which battery has the lowest self-discharge?
A: Primary lithium batteries, especially bobbin-type lithium thionyl chloride (LiSOCl2), have the lowest self-discharge rates (as low as 0.7-1% per year). Among rechargeables, lead-acid[2] and certain lithium-ion (e.g., LFP) are low (~2-5% per month).
Q: Why self-discharge is important in batteries?
A: Self-discharge affects shelf life, readiness for use, and overall performance. High rates limit applications requiring long storage (e.g., emergency devices), reduce effective capacity, and can impact safety or necessitate frequent maintenance.
Table of Contents
- What is the real cost behind cheap batteries?
- How can you model time-based loss in TCO math?
- Which technical factors increase or reduce time-based loss?
- Where does time-based loss hurt the most in the field?
- How can you reduce risk with a practical buying process?
What is the real cost behind cheap batteries?
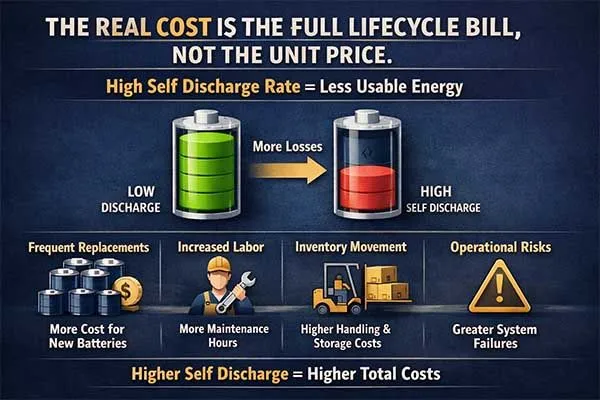
The real cost is the full lifecycle bill, not the unit price. When Self Discharge Rate is high, the program gets less usable energy from each unit, so it pays more for replacements, labor, inventory movement, and operational risk.
A low unit price can still work in short-life products. But many industrial devices target multi-year uptime, and they often sit in storage before they ever power a load.
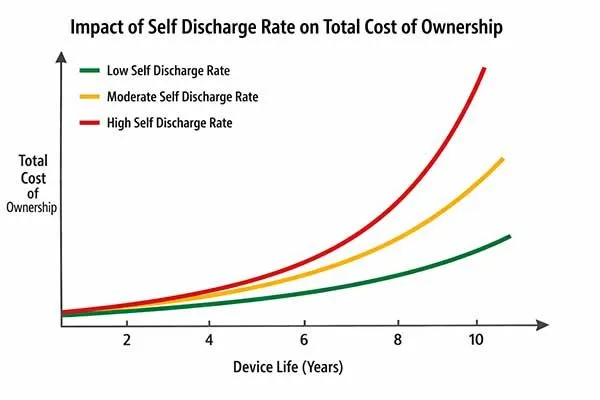
Loss during that waiting time removes part of the reserve margin that engineers planned. The issue looks small at first, but it compounds across a fleet.
Teams also pay for handling, returns, and service scheduling, so the battery line item is not the only number that changes.
Cost drivers that often outweigh unit price
Teams usually compare unit price first because it is easy to measure. Still, the largest costs often show up after installation.
A higher Self Discharge Rate shrinks the reserve margin that protects the design when temperature swings, reporting intervals change, or peak pulses rise.
When reserve shrinks, teams either replace earlier on purpose or accept more failures. Both outcomes raise spending.
Typical TCO items affected by Self Discharge Rate
| TCO item | What you pay | Why it increases |
|---|---|---|
| Replacement parts | More batteries | Less delivered usable energy |
| Field labor | More site visits | Earlier swaps or unplanned failures |
| Logistics & inventory | More shipments and storage | Shorter effective shelf life |
If a device is part of a regulated utility, a safety system, or a healthcare workflow, downtime also has a direct cost.
Even a small gap becomes large when you multiply it by years of service and thousands of endpoints. That is why Self Discharge Rate belongs in TCO, not only in a datasheet footnote.
Want to try real long-term lithium batteries?
Submit the form below, and Long Sing Technology engineers will analyze your power profile for free.
How can you model time-based loss in TCO math?
To model time-based loss in Total Cost of Ownership (TCO) math, apply discounted cash flow (DCF) analysis to convert future costs into present value (PV), accounting for the time value of money. The core formula is:
TCO = Initial Cost + Σ [Time-Based Costsₜ / (1 + r)ᵗ]
Where:
- Time-Based Costsₜ = Costs incurred at time t (e.g., maintenance, energy, depreciation)
- r = Discount rate (reflecting opportunity cost of capital, typically 5–10% for enterprises)
- t = Time period (years)
You can model time-based loss in TCO (Total Cost of Ownership) by turning “loss over time” into a cash-flow series and discounting it to present value.
Start with a baseline asset value or annual benefit, then apply a time function for loss. Here is the key implementation steps:
- Identify time-dependent costs:
- Depreciation (e.g., straight-line: (Asset Cost – Salvage Value)/Useful Life)
- Maintenance (e.g., escalating 5% annually)
- Energy/operational costs (e.g., $X/year rising at 3% inflation)
- Discount all future costs:
- Example: $1,000 maintenance cost in Year 5 at 7% discount rate → PV = $1,000 / (1.07)⁵ ≈ $713.
- Sum all PV costs:TCO = Upfront Cost + PV(Maintenance) + PV(Energy) + …
Convert each period’s loss into dollars (e.g., reduced output, higher energy use, extra maintenance, lost revenue), add end-of-life residual/salvage, and compute NPV of losses using a discount rate so earlier losses weigh more than later ones.
This approach ensures TCO comparisons are economically accurate across assets with different lifespans.
Anyway, to make it simple words, here is a practical method starts with a capacity budget.
First, you list the device energy need, then you add reserve margin.
Next, you subtract losses that happen without useful work. That includes Self Discharge Rate and any constant drain from electronics.
When remaining usable capacity cannot meet the required life, the program must replace sooner. That is when the “cheap” option stops being cheap.
A capacity budget that matches real timelines
The goal is not perfect accuracy. The goal is to avoid a paper design that assumes full nameplate capacity is always available.
You can split time into phases: warehouse storage, shipping, staging, and operation. Then assign each phase an average temperature band, because heat changes time-based loss.
You also track actual storage months from your ERP or logistics logs, because “three months” often becomes “nine months” in real operations.
This approach improves supplier comparisons because every bid uses the same timeline and the same temperature assumption. It also improves service planning because it produces a replacement window you can budget for.
If the model is simple but consistent, it still prevents big TCO mistakes driven by Self Discharge Rate.
Simple inputs for a basic TCO model
| Input | What it represents | Why it matters |
|---|---|---|
| Time before install | Storage + transport months | Longer time increases loss |
| Temperature profile | Typical band by phase | Heat accelerates side reactions |
| Visit cost | Truck roll + labor | Often dominates unit price |
Which technical factors increase or reduce time-based loss?
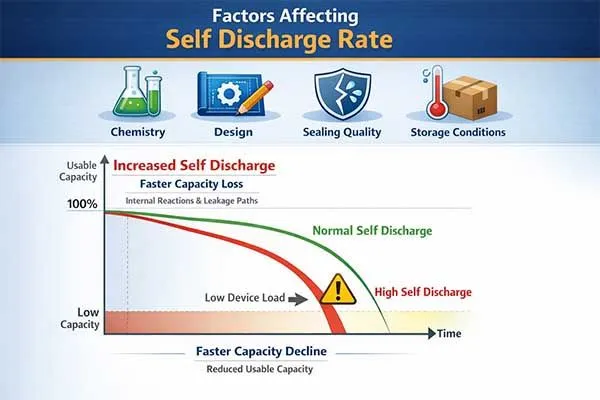
Chemistry, design, sealing quality, and storage conditions shape Self Discharge Rate. When internal side reactions or leakage paths increase, usable capacity falls faster even when the device load is low.
Primary lithium is not one chemistry, so you should avoid one-size rules.
For long-life, low-current devices, engineers often consider lithium thionyl chloride cells, also called LiSOCl2, because they can support long calendar life when the design and process control are strong.
Some systems also add a pulse buffer, such as a hybrid supercapacitor, to handle short high-current pulses while keeping average drain low.
Drivers you can control and drivers you must design around
Temperature is usually the biggest external driver because reaction rates rise as temperature rises.
Seal integrity is a key manufacturing driver because moisture ingress or weak sealing increases internal reactions.
Impurities and process variation can also create more reaction sites inside the cell. A system can create apparent loss too. A “sleeping” PCB can still draw microamps, and that drain can look like a higher Self Discharge Rate if you do not measure it.
At Long Sing Technology, we often see this during early field debugging, especially in metering and remote monitoring designs.
Teams get better decisions when they separate system sleep current from cell behavior, and then they evaluate Self Discharge Rate under the real temperature band and real storage timeline that the program will face.
Common drivers and practical checks
| Driver | Typical effect | Simple check |
|---|---|---|
| High storage temperature | Faster time-based loss | Aging test at your worst-case band |
| Seal variation | Higher internal reactions | Leak screening + lot sampling |
| PCB sleep current | Apparent higher loss | Measure microamp drain over weeks |
Where does time-based loss hurt the most in the field?
Time-based loss hurts most when access is expensive, when spares sit for long periods, or when power must be ready on day one after storage. In these cases, a higher Self Discharge Rate raises service frequency and uptime risk.
A low-cost choice can be correct when service access is easy and life is short. But many industrial programs have the opposite setting.
Meters and sensor nodes are spread out, and each visit has a fixed cost. Spare units sit for months, and then they must run for years.
In these settings, a high Self Discharge Rate becomes a business problem because the budget assumes fewer replacements than the field reality.
A European pipeline monitoring case without extra buffering
At Long Sing Technology, we worked with a European pipeline monitoring equipment manufacturer that needed long-term stable power for remote valve stations.
The operator required predictable reserve energy at commissioning, even after long storage and seasonal heat exposure. The previous supplier offered a low price, but the installed base showed early replacements and extra site visits.
Our solution did not add extra energy buffer hardware, and it did not rely on a hybrid supercapacitor.
Instead, we tightened the capacity budget, aligned storage rules with the deployment plan, and selected a cell configuration and process controls that reduced risk from Self Discharge Rate under the customer’s real temperature profile[3].
We also set lot traceability and acceptance sampling so the customer could link any field drift back to a batch and respond faster.
Field patterns that amplify the impact of Self Discharge Rate
| Pattern | Why it matters | Common consequence |
|---|---|---|
| Remote assets | Visits cost a lot | Earlier replacements |
| Long spares storage | Capacity erodes before use | Commissioning failures |
| Uptime obligations | Risk has a real cost | Escalations and penalties |
How can you reduce risk with a practical buying process?
You reduce risk by defining an acceptable Self Discharge Rate, validating it at your temperatures, and controlling lots from incoming inspection through field tracking. This turns Self Discharge Rate from a vague claim into a managed parameter.
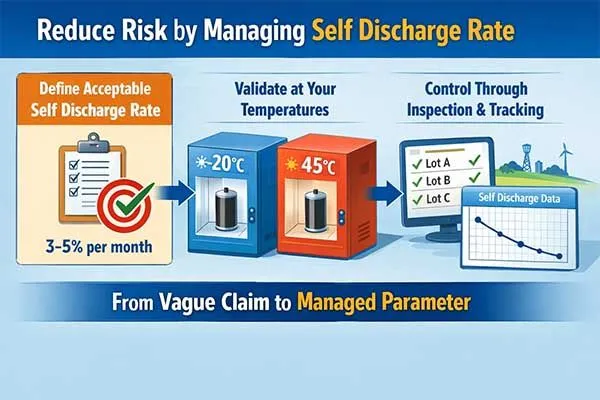
A program does not need a lab to start. It needs repeatable checks and clear acceptance criteria. It also needs documentation that matches the real use case.
If you store inventory, ask for aging data that matches your storage plan. If you deploy in heat, ask for data at that heat. If you use pulse loads, test the system at those loads, not only the cell.
A simple process that fits real procurement constraints
Start with a written timeline that includes storage, transit, staging, and operating life. Then match chemistry and format to the load profile.
For long-life nodes, many teams compare LiSOCl2 options with other primary types using the same temperature assumptions.
Next, define incoming checks. Many teams start with open-circuit voltage sampling and a small aging sample at an elevated temperature that matches their worst-case storage band.
They also track batch IDs into the field so they can link any drift back to a lot.
If the design uses a battery pack, teams should validate pack-level leakage paths and connector quality, because these can change apparent Self Discharge Rate at the system level.
A consistent buying process reduces “surprise” costs and makes the vendor comparison fair.
Practical controls that reduce TCO risk
| Control | What you do | What it prevents |
|---|---|---|
| Acceptance spec | Set loss limits by time and temperature | Unfair or vague comparisons |
| Incoming sampling | OCV checks + small aging sample | Weak lots entering builds |
| Lot traceability | Track batch IDs into the field | Slow root-cause response |
For search clarity, teams may use these terms in notes and RFQs: self discharge, self discharge, self discharge.
Some engineers also write self discharge battery, self discharge battery, self discharge battery.
In logistics discussions, buyers sometimes write batteries self discharge, batteries self discharge, batteries self discharge.
In comparison charts, a team may note lithium metal battery self discharge rate once, and it may compare li ion battery self discharge rate once.
In troubleshooting logs, teams may use battery self discharge, and they may also write self discharge of battery when they mean the same time-based loss.
Conclusion
A high Self Discharge Rate can turn a low unit price into a higher lifecycle bill, especially when devices sit in storage and then must run for years.
A basic model links Self Discharge Rate to timelines, temperatures, and service cost. Chemistry choice and process control both matter, so buyers should validate data at relevant temperatures, track lots, and price service visits.
When a program needs long shelf life and high reliability, these steps reduce site visits and protect uptime.
Note:
[1]Depth of Discharge is key to extending battery life; learn how to manage it effectively.↪
Also read further information about lithium metal battery:
- The Ultimate Guide to Lithium Metal Battery for Professionals
- What Makes the Science Behind Lithium Thionyl Chloride Battery So Unique?
- The 3.0V Standard: Unlocking the Power of Lithium Manganese Dioxide Batteries
- How to Choose Between Lithium Metal vs Lithium Ion?
- Beyond 500 Wh/kg: Lithium Metal Battery Energy Density Under Real IoT Load Conditions
- The Science of the Plateau: Why Voltage Stability is the Lifeline of in Power System
- Operating Temperature Range: How temperature affects lithium metal battery performance
- The Silent Shelf-Life Secret: Why Battery Passivation is Actually a Good Thing
- Mechanical Robustness: Designing Robust Battery That Survive Shock, Vibration, and Long-Term Stress
- Lithium Metal Batteries for Long-Life Industrial Applications: Design and Performance Insights
- Thermal Runaway Prevention: Why Factory-Level Testing is Non-Negotiable for Lithium Battery Safety
- Lithium Metal Battery Long Term Cost Analysis: Initial Price vs Lifetime Value
- Solid state batteries vs lithium metal batteries: Which One Elevates Your Product Performance?
IoT Battery Optimization Strategies: Proven Hardware, Firmware & Connectivity Strategies for Industrial Deployments
Deploying industrial sensors often leads to premature field failures due to unoptimized power profil

Battery Temperature: How Does Extreme Temperatures Affect Long-Term Reliability
When devices fail early, battery temperature is often the hidden cause. Batteries lose performance w

Total Cost of Ownership: How to calculate the TCO in battery
Total Cost of Ownership (TCO) in batteries is the full cost of having and using a battery over its e